Arizona Moving Report 2027
Who moves in Arizona, where they come from, when they move — and the companies that move them. Census, IRS, NOAA, BLS and FMCSA data, plus our scan of 72 Arizona moving websites.
Moved in the past year
1 in 7 Arizonans
- Arizona
- 13.8%
- People
- 1,032,583
- United States
- 11.8%
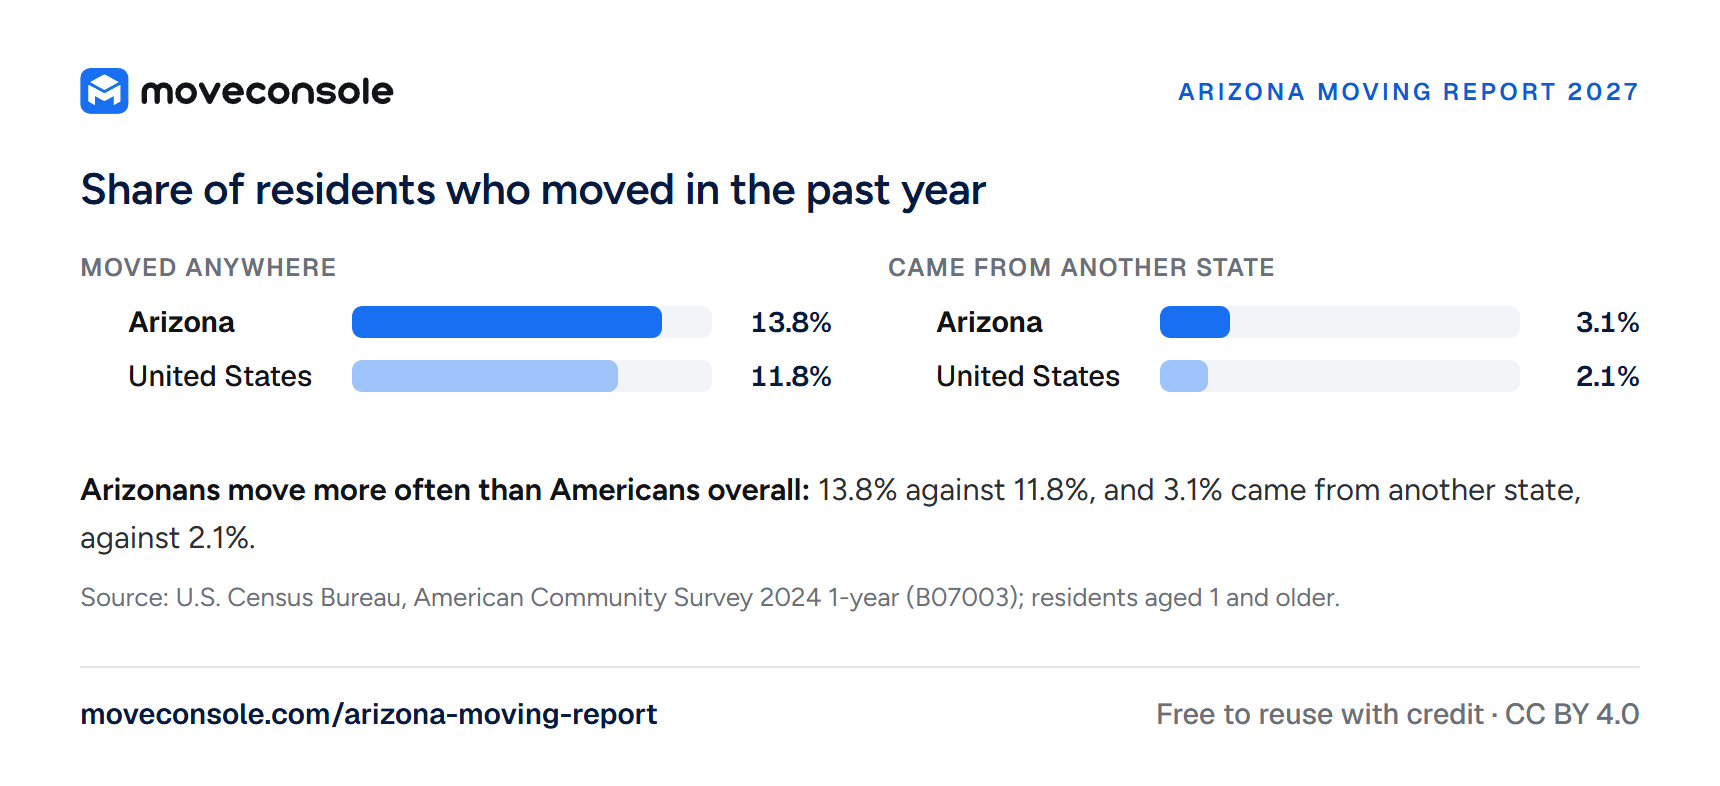
1,032,583 Arizonans lived in a different home a year earlier: 13.8% of residents, against 11.8% nationally. Source: U.S. Census Bureau, American Community Survey 2024 1-year (B07003).
In short
- One in seven Arizonans moved in the past year: 1,032,583 people, or 13.8% of residents, against 11.8% nationally.
- Maricopa County gained 13,793 people and about $1.8 billion in income from other states in a single tax year. Los Angeles County sends the most people; households from Seattle’s King County report about twice the county’s average income.
- Phoenix hit 110°F or hotter on a record 70 days in 2024. In July it stays at 100°F or above about ten hours a day — and yet Arizonans search for movers most in June.
- Four in five of Arizona’s 410 active moving companies run one to three trucks, and fewer than half of those registered in 2021–2023 are still active.
- Of 72 Arizona moving websites we scanned, 57% have an online quote form, 10% post hourly rates — and none offers service in Spanish, the home language of nearly one Arizonan in five.
One in seven Arizonans moved last year
Arizona is a state on the move. In the Census Bureau’s 2024 American Community Survey, 13.8% of Arizonans said they had lived in a different home a year earlier. That is 1,032,583 people, roughly one resident in seven. Across the United States the share was 11.8%.
Most of those moves are short: across town, into a bigger apartment, into a first house. But Arizona also pulls people from far away. Within the year, 3.1% of Arizonans had arrived from another state, against 2.1% for the country as a whole. Published analyses of the same survey put the number of people who moved to Arizona from other states in 2024 at about 235,000, with California (52,400), Washington (17,600) and Texas (10,300) the largest sources. The University of Arizona’s Eller College ranked Arizona fourth among the states for net domestic migration in 2024, with a gain of 55,505 people, and U-Haul’s Growth Index placed Arizona seventh for 2025 — its sixth year in a row in the top ten.
Share of residents who moved in the past year
Moved anywhere
Came from another state
Show the data
| Arizona | United States | |
|---|---|---|
| Moved in the past year | 13.8% | 11.8% |
| From another state | 3.1% | 2.1% |
| People who moved, Arizona | 1,032,583 | — |
The survey counts people, not households, and it is an estimate with a margin of error. The statewide figure is precise; numbers for single cities, below, are less so.
Who’s moving in, and from where
The IRS sees moves through tax returns. When the address on a household’s return moves to another county from one year to the next, the move appears in its migration data, together with the household’s adjusted gross income (AGI). The latest files cover returns for 2022 and 2023, and they show who is arriving — and how much they earn.
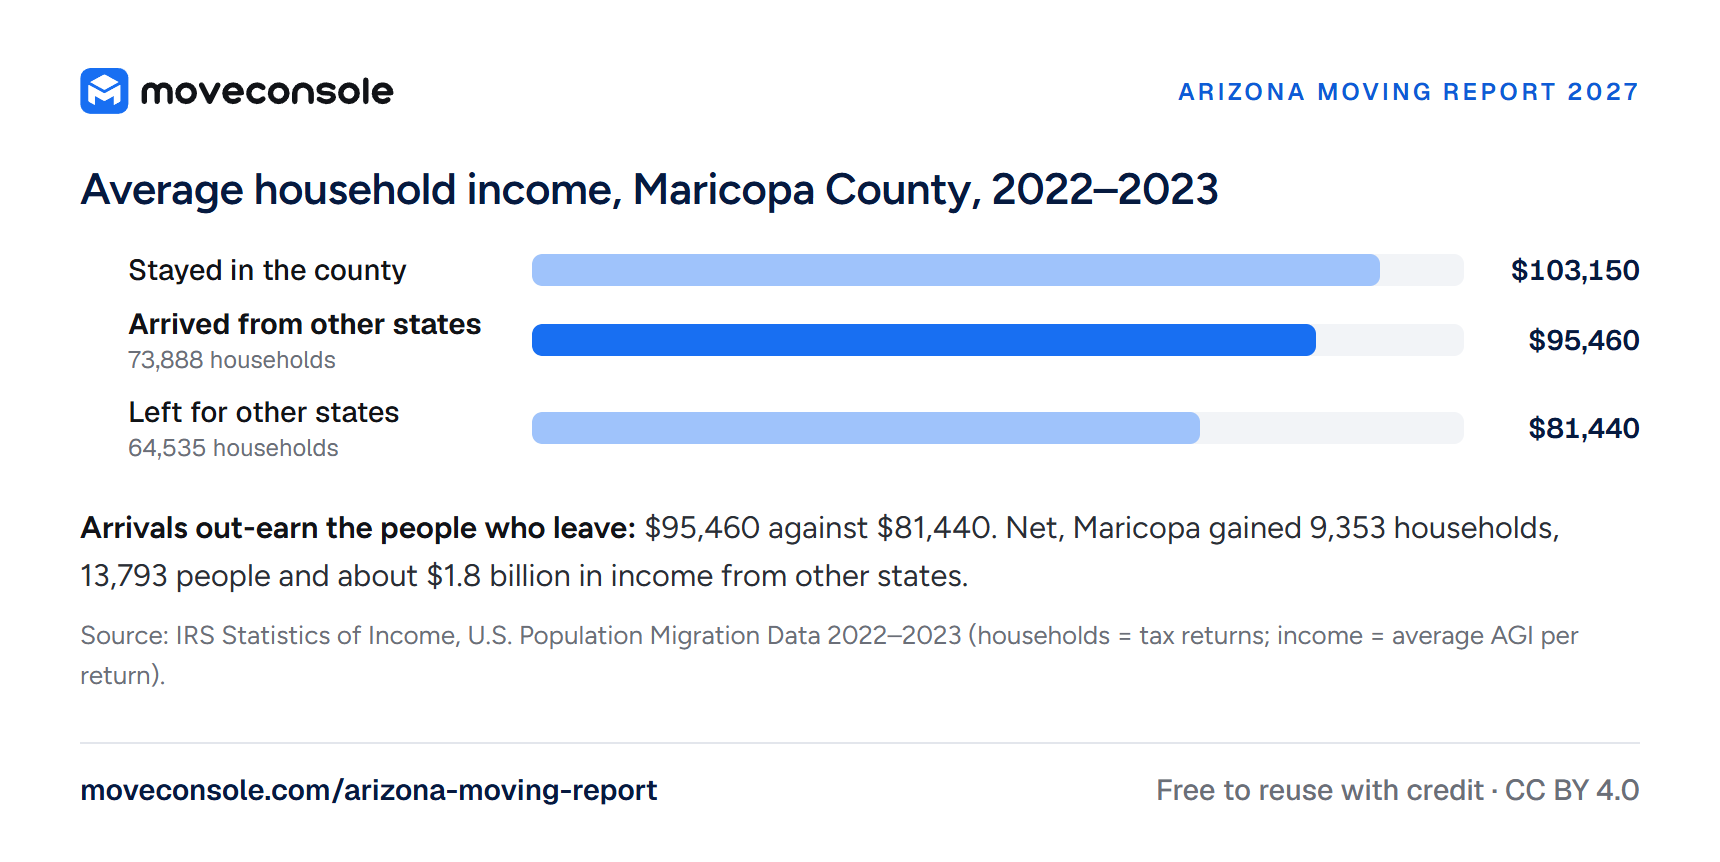
In Maricopa County, home to Phoenix and most Arizonans, 73,888 households (120,316 people) arrived from other states, with an average AGI of $95,460. Going the other way, 64,535 households (106,523 people) left for other states, averaging $81,440. The county came out 9,353 households and 13,793 people ahead, with about $1.8 billion more income arriving than leaving. Households that stayed put reported an average AGI of $103,150.
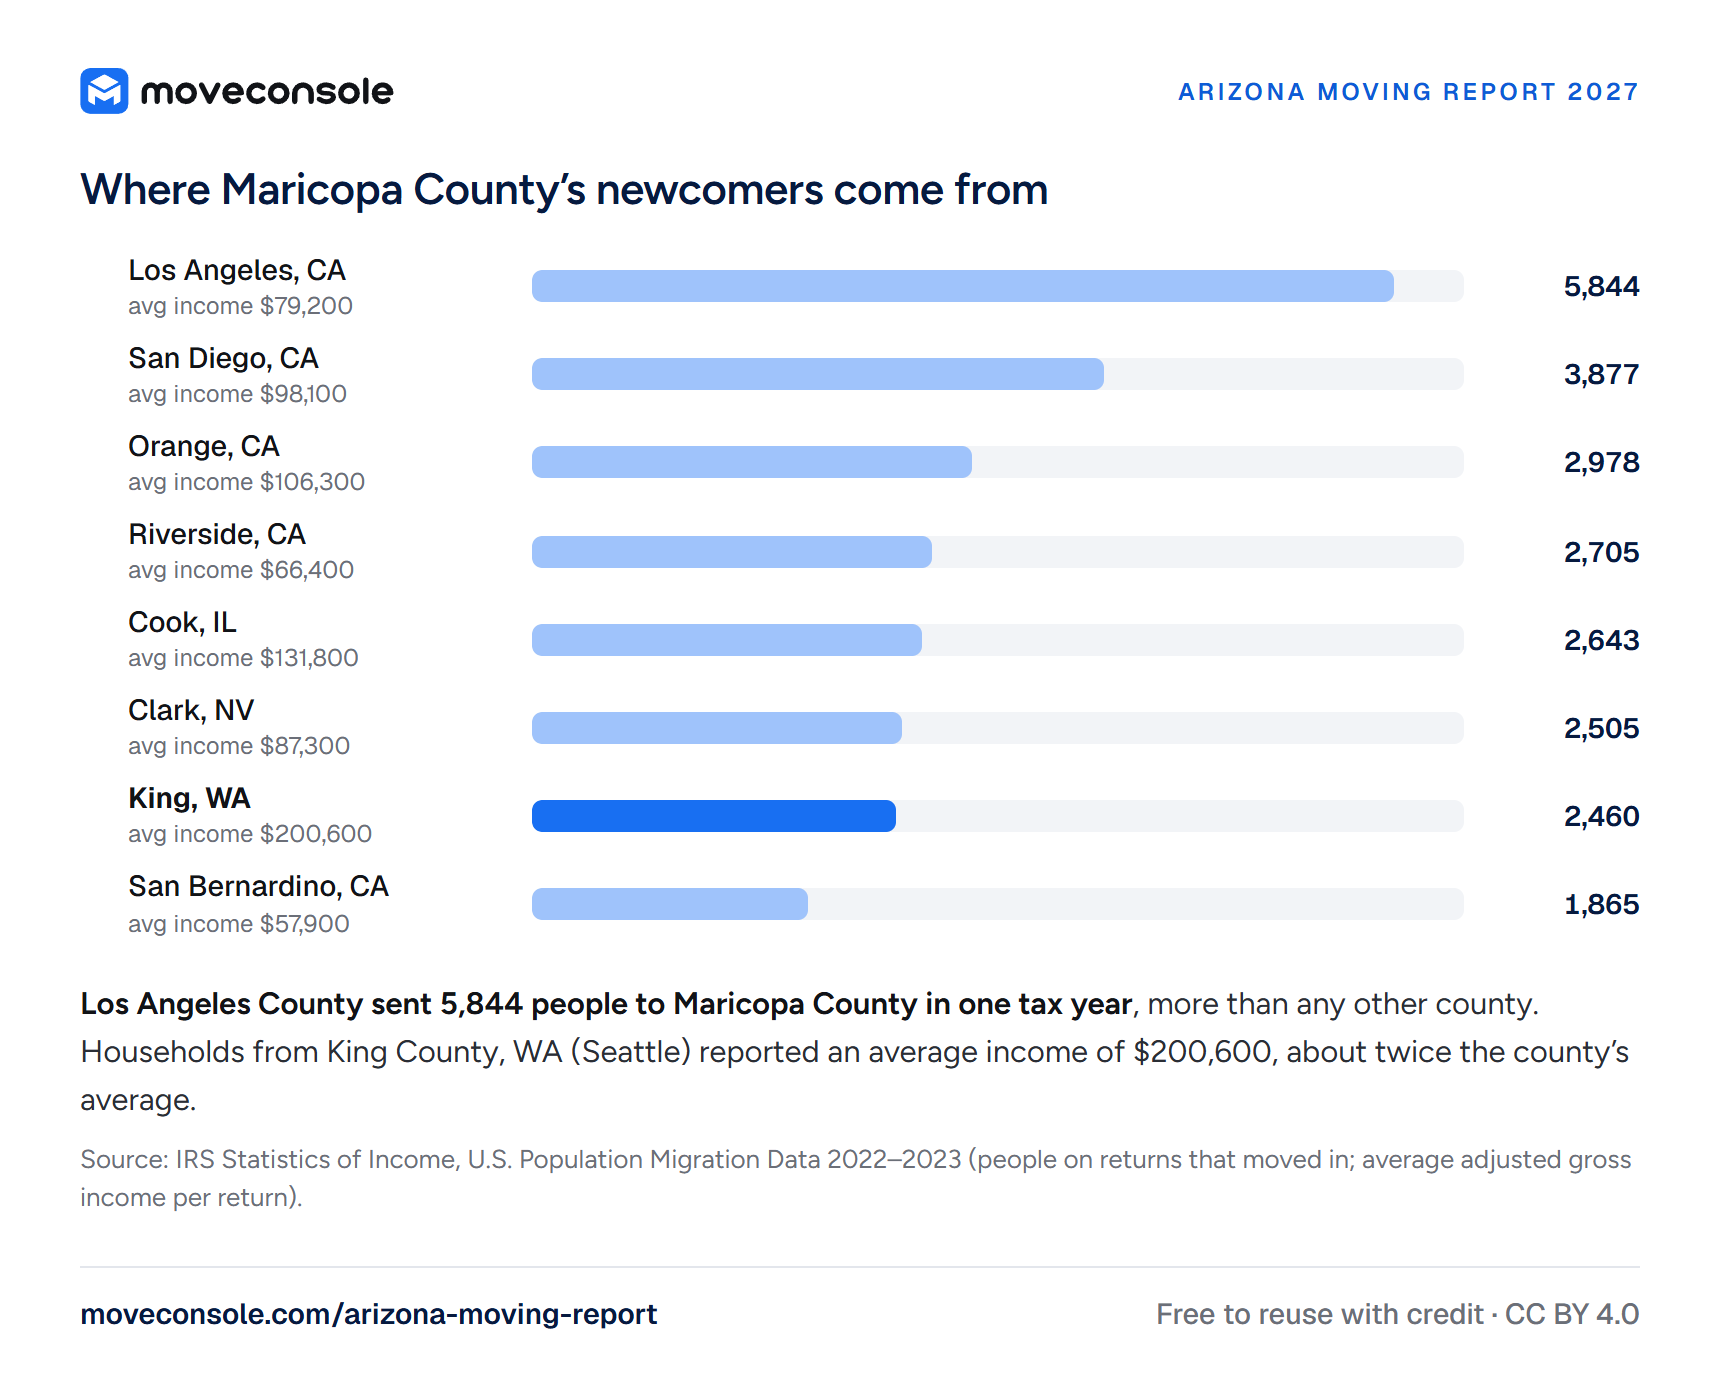
Where Maricopa County’s newcomers come from
Show the data
| Origin county | People | Average AGI |
|---|---|---|
| Los Angeles County, CA | 5,844 | $79,200 |
| San Diego County, CA | 3,877 | $98,100 |
| Orange County, CA | 2,978 | $106,300 |
| Riverside County, CA | 2,705 | $66,400 |
| Cook County, IL | 2,643 | $131,800 |
| Clark County, NV | 2,505 | $87,300 |
| King County, WA | 2,460 | $200,600 |
| San Bernardino County, CA | 1,865 | $57,900 |
Southern California is the biggest feeder. Los Angeles County sent 5,844 people to Maricopa County, more than any other county in the country, and San Diego (3,877), Orange (2,978) and Riverside (2,705) follow; four of the top eight origins are in Southern California. Cook County, Illinois (2,643), Clark County, Nevada (2,505), King County, Washington (2,460) and San Bernardino County (1,865) complete the list.
The incomes differ widely. Households arriving from King County — Seattle — reported an average AGI of $200,600, about twice the Maricopa average. Households from Cook County (Chicago) averaged $131,800 and from Orange County $106,300, while those from Riverside ($66,400) and San Bernardino ($57,900) earned less than the households already in Maricopa.
Average household income, Maricopa County, 2022–2023
Show the data
| Households | People | Average AGI | |
|---|---|---|---|
| Arrived from other states | 73,888 | 120,316 | $95,460 |
| Left for other states | 64,535 | 106,523 | $81,440 |
| Net gain | +9,353 | +13,793 | +$1.80 billion (total) |
| Stayed in the county | — | — | $103,150 |
| Pima County: in / out | 16,272 / 14,647 | — | $82,300 / $74,700 |
| Pinal County: in / out | 8,131 / 5,641 | — | $77,500 / $62,700 |
The pattern repeats outside the Phoenix area. Pima County (Tucson) took in 16,272 households from other states, with an average AGI of $82,300, and lost 14,647, averaging $74,700. Pinal County took in 8,131 households from other states ($77,500) against 5,641 leaving ($62,700) — and it draws heavily from its big neighbor: counting arrivals from Maricopa County, 20,487 households moved into Pinal in total.
The IRS files count households that file returns; people who don’t file, and very recent arrivals, are missing, and AGI is a year’s income, not wealth.
Where Arizona moves, city by city
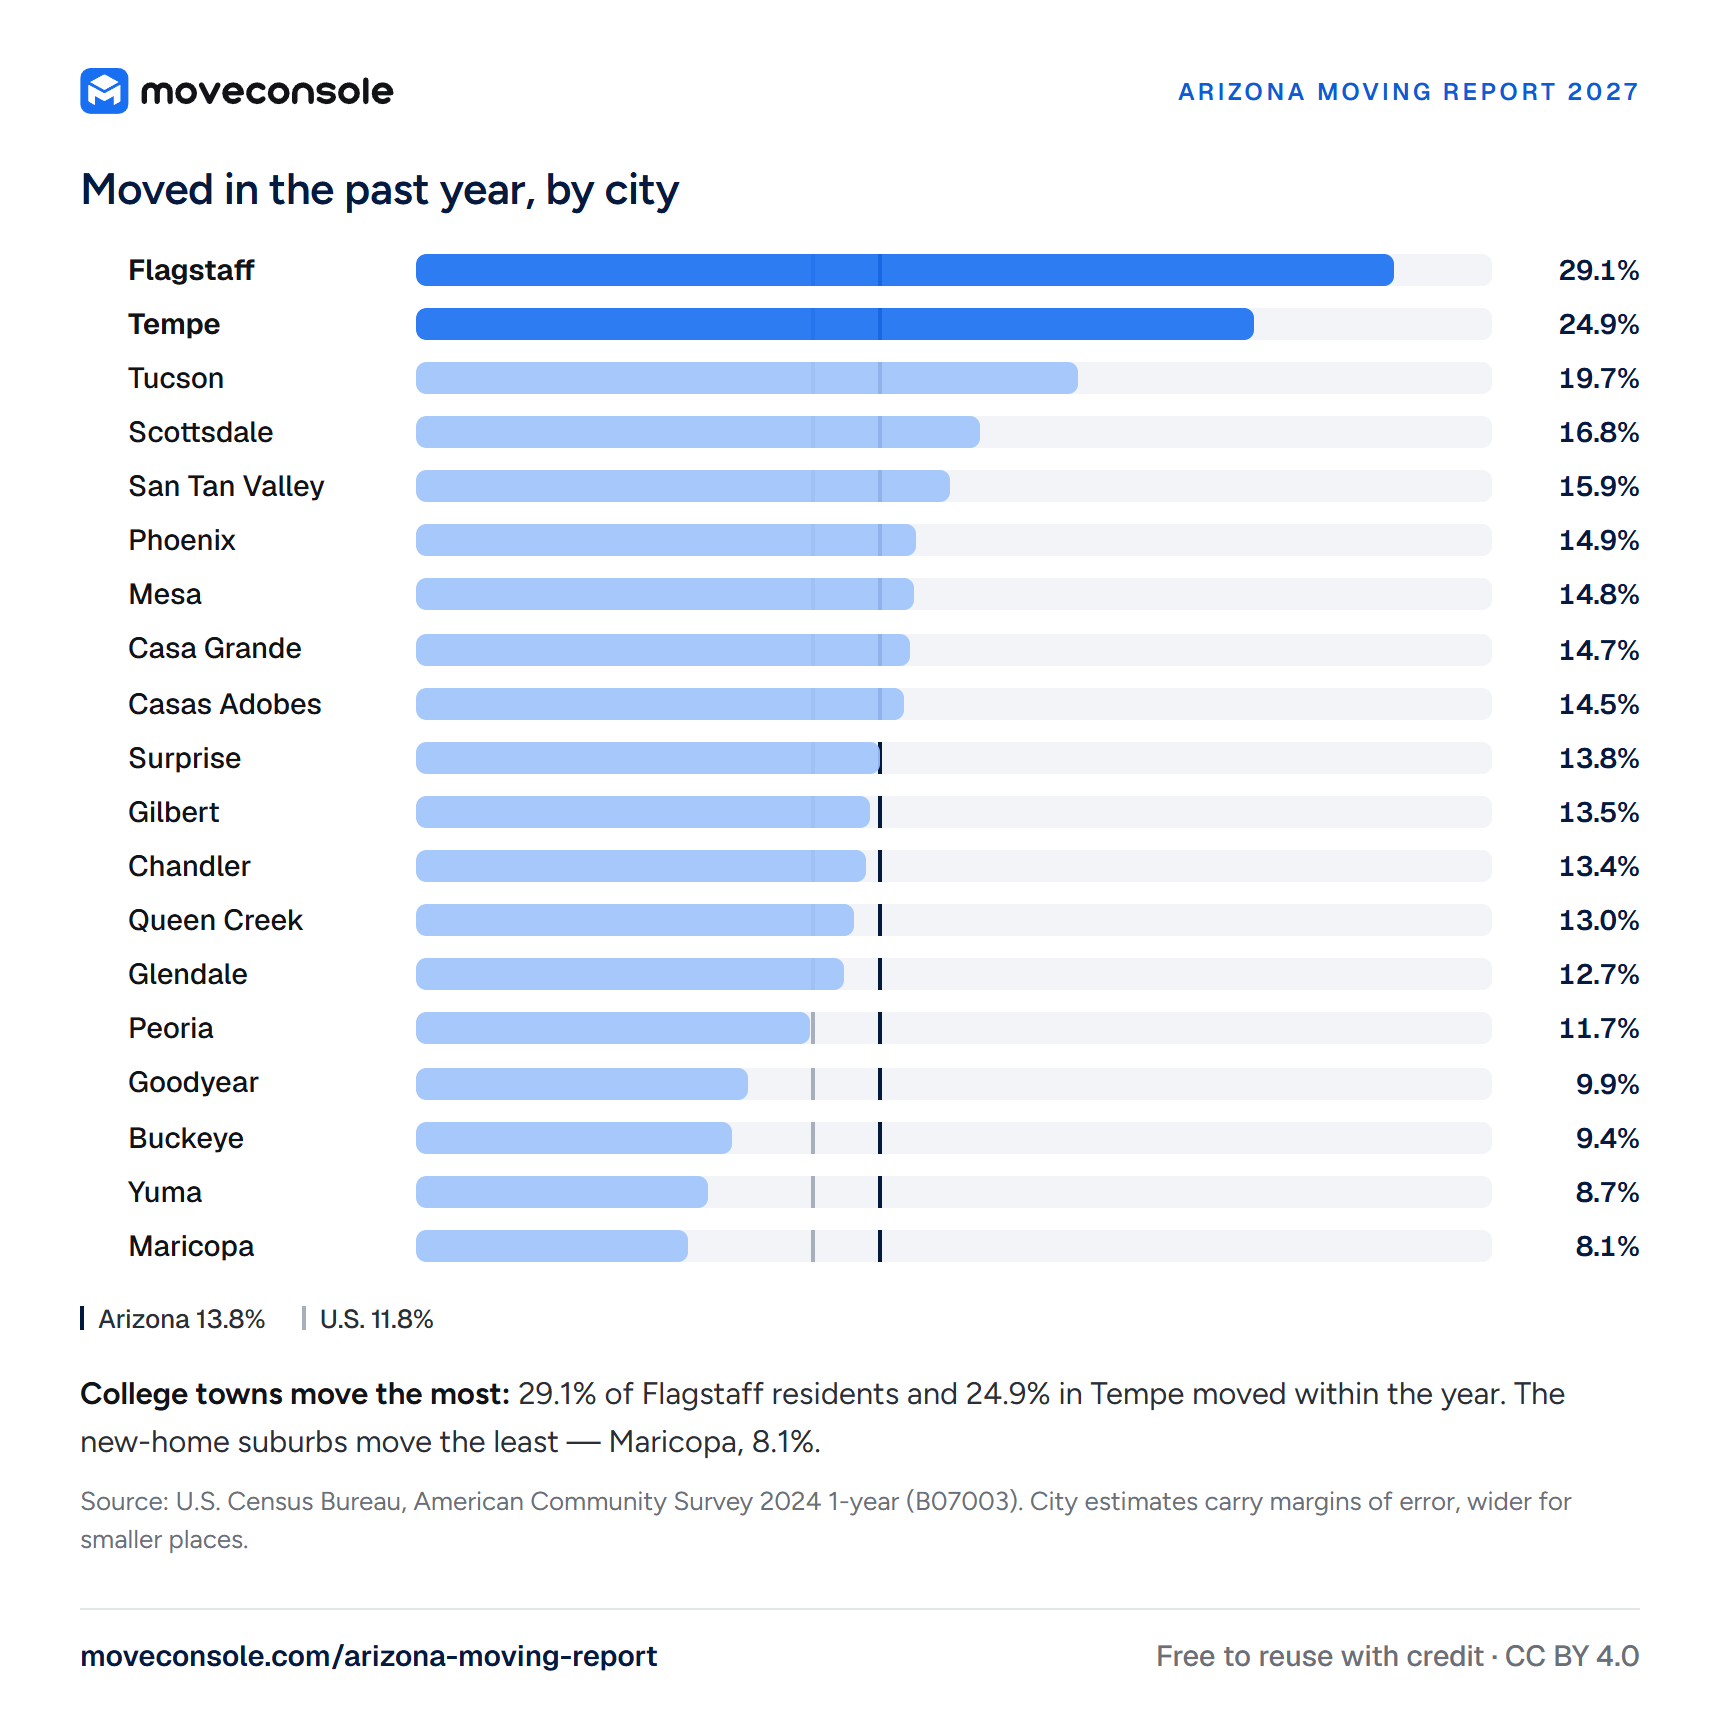
How often people move depends a great deal on where they live. The survey’s city estimates show two kinds of place at the ends of the scale.
Moved in the past year, by city
Arizona 13.8%U.S. 11.8%
Show the data
| City | Moved in the past year | From another state | People who moved |
|---|---|---|---|
| Flagstaff | 29.1% | 5.9% | 22,415 |
| Tempe | 24.9% | 4.4% | 46,871 |
| Tucson | 19.7% | 3.5% | 108,057 |
| Scottsdale | 16.8% | 4.5% | 40,983 |
| San Tan Valley | 15.9% | 3.5% | 19,409 |
| Phoenix | 14.9% | 2.5% | 246,314 |
| Mesa | 14.8% | 4.1% | 75,545 |
| Casa Grande | 14.7% | 2.9% | 9,922 |
| Casas Adobes | 14.5% | 4.9% | 10,703 |
| Surprise | 13.8% | 2.9% | 22,947 |
| Gilbert | 13.5% | 3.7% | 38,459 |
| Chandler | 13.4% | 2.4% | 37,441 |
| Queen Creek | 13.0% | 4.1% | 11,857 |
| Glendale | 12.7% | 2.5% | 32,379 |
| Peoria | 11.7% | 1.7% | 22,946 |
| Goodyear | 9.9% | 1.8% | 11,511 |
| Buckeye | 9.4% | 2.9% | 10,640 |
| Yuma | 8.7% | 3.3% | 8,910 |
| Maricopa | 8.1% | 2.5% | 6,185 |
College towns move the most. In Flagstaff, home of Northern Arizona University, 29.1% of residents moved within the year; in Tempe, home of Arizona State University, 24.9%. Student leases turn over every year, and so do the people in them. Tucson follows at 19.7%. Phoenix sits close to the state average at 14.9% — but that is 246,314 people, far more than any other city — and Mesa is similar at 14.8%.
The fast-growing suburbs move the least. Goodyear (9.9%), Buckeye (9.4%) and Maricopa (8.1%), together with Yuma (8.7%), are at the bottom of the list. Much of their growth is new houses, and the people who just bought them are staying put; growth there shows up as arrivals, not as churn.
City estimates carry wider margins of error than the statewide figure, especially for the smaller places, so differences of a point or two between cities are not meaningful.
When Arizona moves: the heat calendar
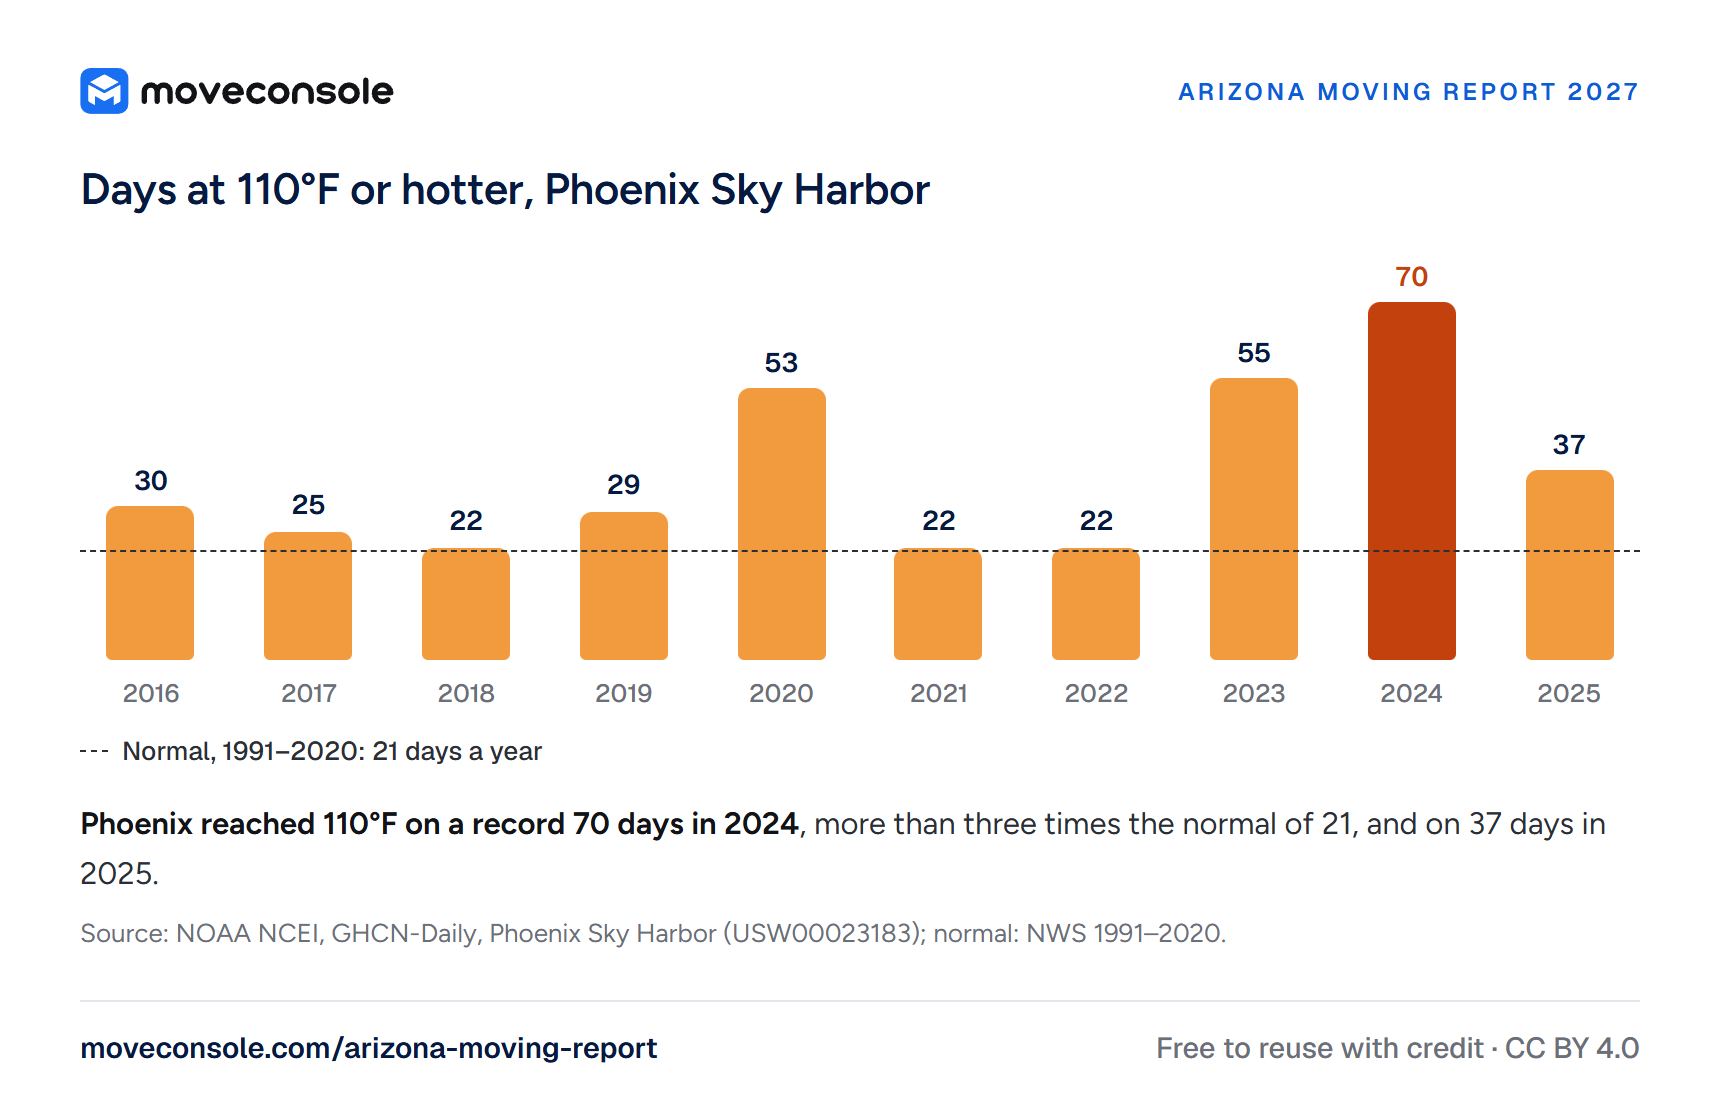
Arizona’s moving season runs straight into its hottest weather. At Phoenix Sky Harbor, NOAA’s station records count the days that reach 110°F or more:
Days at 110°F or hotter, Phoenix Sky Harbor
- 302016
- 252017
- 222018
- 292019
- 532020
- 222021
- 222022
- 552023
- 702024
- 372025
Normal, 1991–2020: 21 days a year
Show the data
| Year | Phoenix: days ≥110°F | Tucson: days ≥110°F |
|---|---|---|
| 2016 | 30 | 5 |
| 2017 | 25 | 7 |
| 2018 | 22 | 3 |
| 2019 | 29 | 2 |
| 2020 | 53 | 8 |
| 2021 | 22 | 8 |
| 2022 | 22 | 2 |
| 2023 | 55 | 18 |
| 2024 | 70 | 6 |
| 2025 | 37 | 7 |
The 1991–2020 normal is 21 such days a year. Phoenix logged 70 in 2024, a record, after 55 in 2023, and 37 in 2025. In 2024 the city reached 100°F or more on 143 days; in 2025, on 122. Tucson is milder — 18 days at 110°F in 2023, 6 in 2024 and 7 in 2025 — and Flagstaff, at about 7,000 feet, has not reached 110°F once in twenty years.
The heat clock
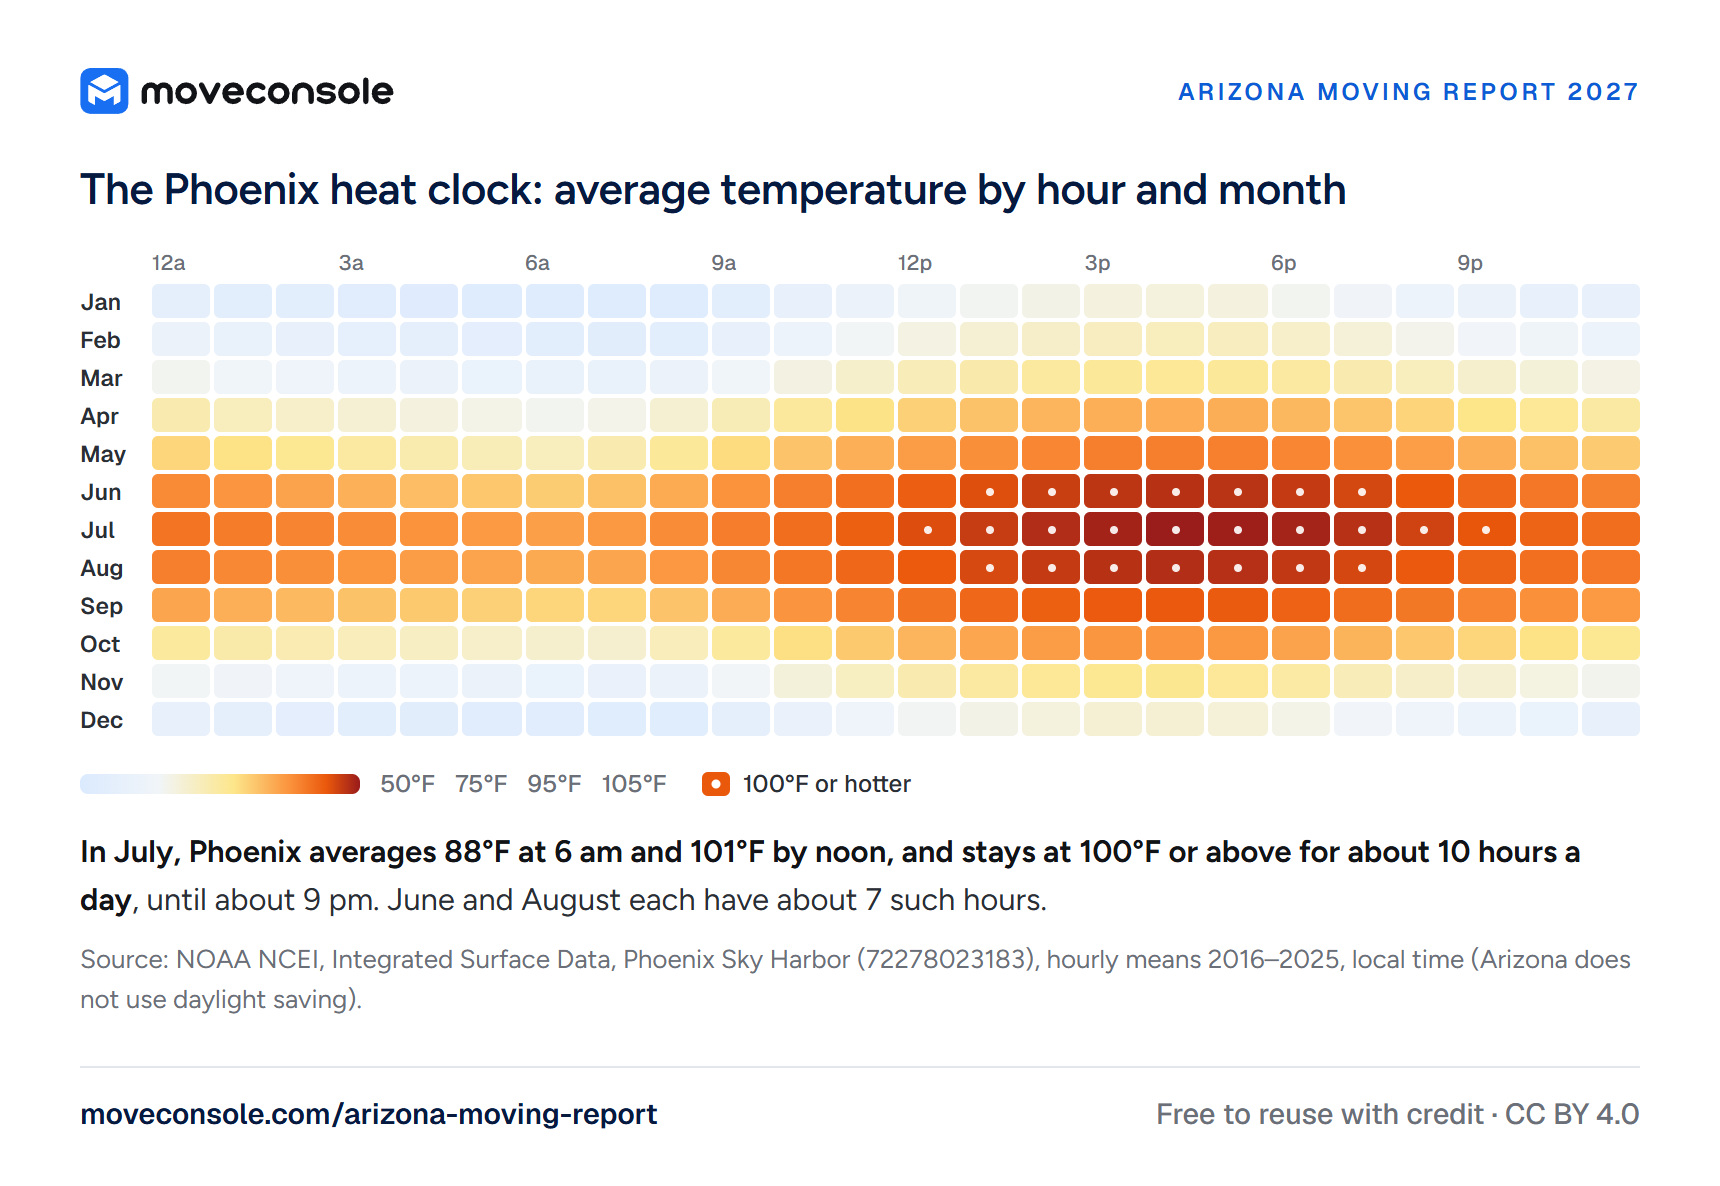
For a moving crew, the hour matters as much as the day. We averaged NOAA’s hourly observations at Phoenix Sky Harbor for 2016–2025 into a “heat clock”: the typical temperature for every hour of every month. Times are local; Arizona does not use daylight saving time.
The Phoenix heat clock: average temperature by hour and month
50°F75°F95°F105°F100°F or hotter
Show the data
| Month | 6 am | 9 am | Noon | 3 pm | 5 pm | 9 pm | Hours ≥100°F |
|---|---|---|---|---|---|---|---|
| Jan | 47.8°F | 50.7°F | 60.8°F | 65.7°F | 65.8°F | 57.0°F | 0 |
| Feb | 51.1°F | 55.1°F | 65.2°F | 70.2°F | 70.4°F | 62.0°F | 0 |
| Mar | 56.0°F | 61.6°F | 71.2°F | 75.8°F | 75.9°F | 68.3°F | 0 |
| Apr | 63.4°F | 71.7°F | 81.1°F | 85.8°F | 86.0°F | 78.0°F | 0 |
| May | 70.7°F | 79.5°F | 88.5°F | 93.2°F | 93.1°F | 85.9°F | 0 |
| Jun | 81.7°F | 89.9°F | 98.9°F | 103.9°F | 104.2°F | 97.3°F | 7 |
| Jul | 88.1°F | 93.6°F | 101.1°F | 106.1°F | 106.6°F | 100.2°F | 10 |
| Aug | 86.6°F | 91.9°F | 99.7°F | 104.4°F | 104.6°F | 98.0°F | 7 |
| Sep | 80.3°F | 86.3°F | 95.2°F | 99.6°F | 99.4°F | 92.2°F | 0 |
| Oct | 68.4°F | 75.1°F | 85.0°F | 89.4°F | 89.0°F | 80.5°F | 0 |
| Nov | 56.8°F | 62.3°F | 72.6°F | 76.9°F | 76.0°F | 67.4°F | 0 |
| Dec | 49.3°F | 52.4°F | 62.7°F | 67.3°F | 66.7°F | 58.3°F | 0 |
In July, the coolest hour comes around 6 a.m., at 88°F. By noon the average is 101°F, and it stays at 100°F or above for about ten hours, until about 9 p.m. June and August each have about seven such hours. The working window is short: in July the first three hours of a 6 a.m. start average 88–91°F, and the afternoon peaks near 107°F around 4–5 p.m.
Arizona moves in the heat
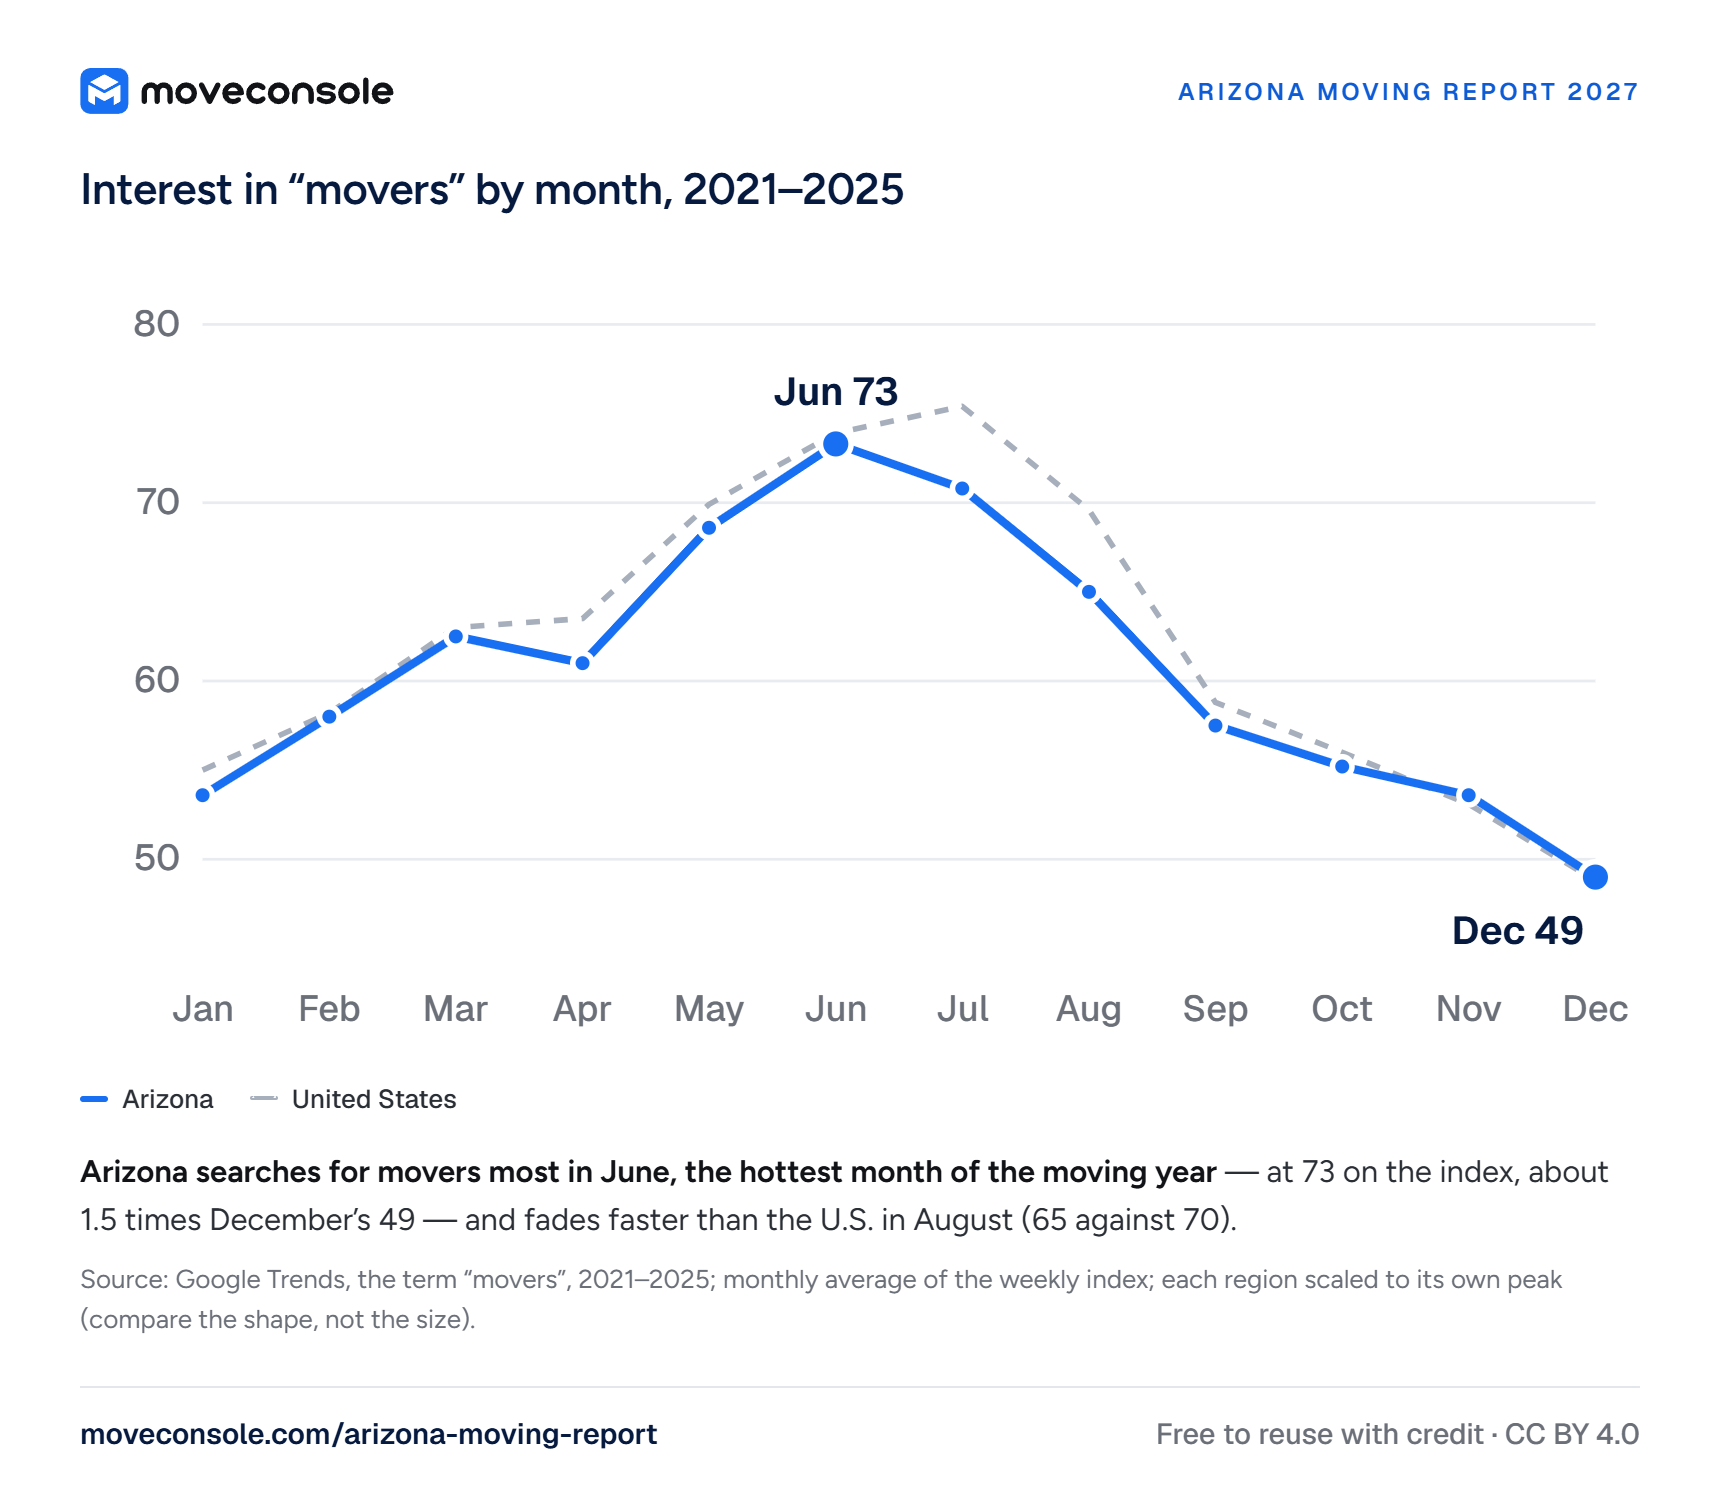
None of this stops Arizona from moving in summer. Google Trends shows how interest in “movers” changes through the year (2021–2025, each region scaled to its own peak):
Interest in “movers” by month, 2021–2025
ArizonaUnited States
Show the data
| Month | Arizona | United States |
|---|---|---|
| Jan | 53.6 | 55.0 |
| Feb | 58.0 | 58.2 |
| Mar | 62.5 | 63.0 |
| Apr | 61.0 | 63.5 |
| May | 68.6 | 69.9 |
| Jun | 73.3 | 73.9 |
| Jul | 70.8 | 75.4 |
| Aug | 65.0 | 69.6 |
| Sep | 57.5 | 58.8 |
| Oct | 55.2 | 56.0 |
| Nov | 53.6 | 53.1 |
| Dec | 49.0 | 48.8 |
Arizona’s searches for movers peak in June — the hottest stretch of the moving year — at about 1.5 times December’s level, and stay high in July. Nationally, interest peaks in June and July together. Arizona’s peak comes a little earlier and fades faster: by August, Arizona is at 65 on the index while the country is still at 70. School calendars and leases set the date of a move; the weather only sets its hours.
Google Trends is a relative index, not a count of searches. Each region is scaled to its own peak, so the two curves compare the shape of the year, not its size.
Who moves Arizona: the industry
To count Arizona’s moving companies, we used the federal register of motor carriers, FMCSA’s Company Census File. We took carriers based in Arizona, listing household goods as cargo, with “mov”, “van line” or “relocat” in their legal or trade name. The name filter misses some movers with other names, so the counts below are a slight undercount.
410 moving companies hold an active USDOT number in Arizona. 200 of them filed the required update of their registration in the last two years.
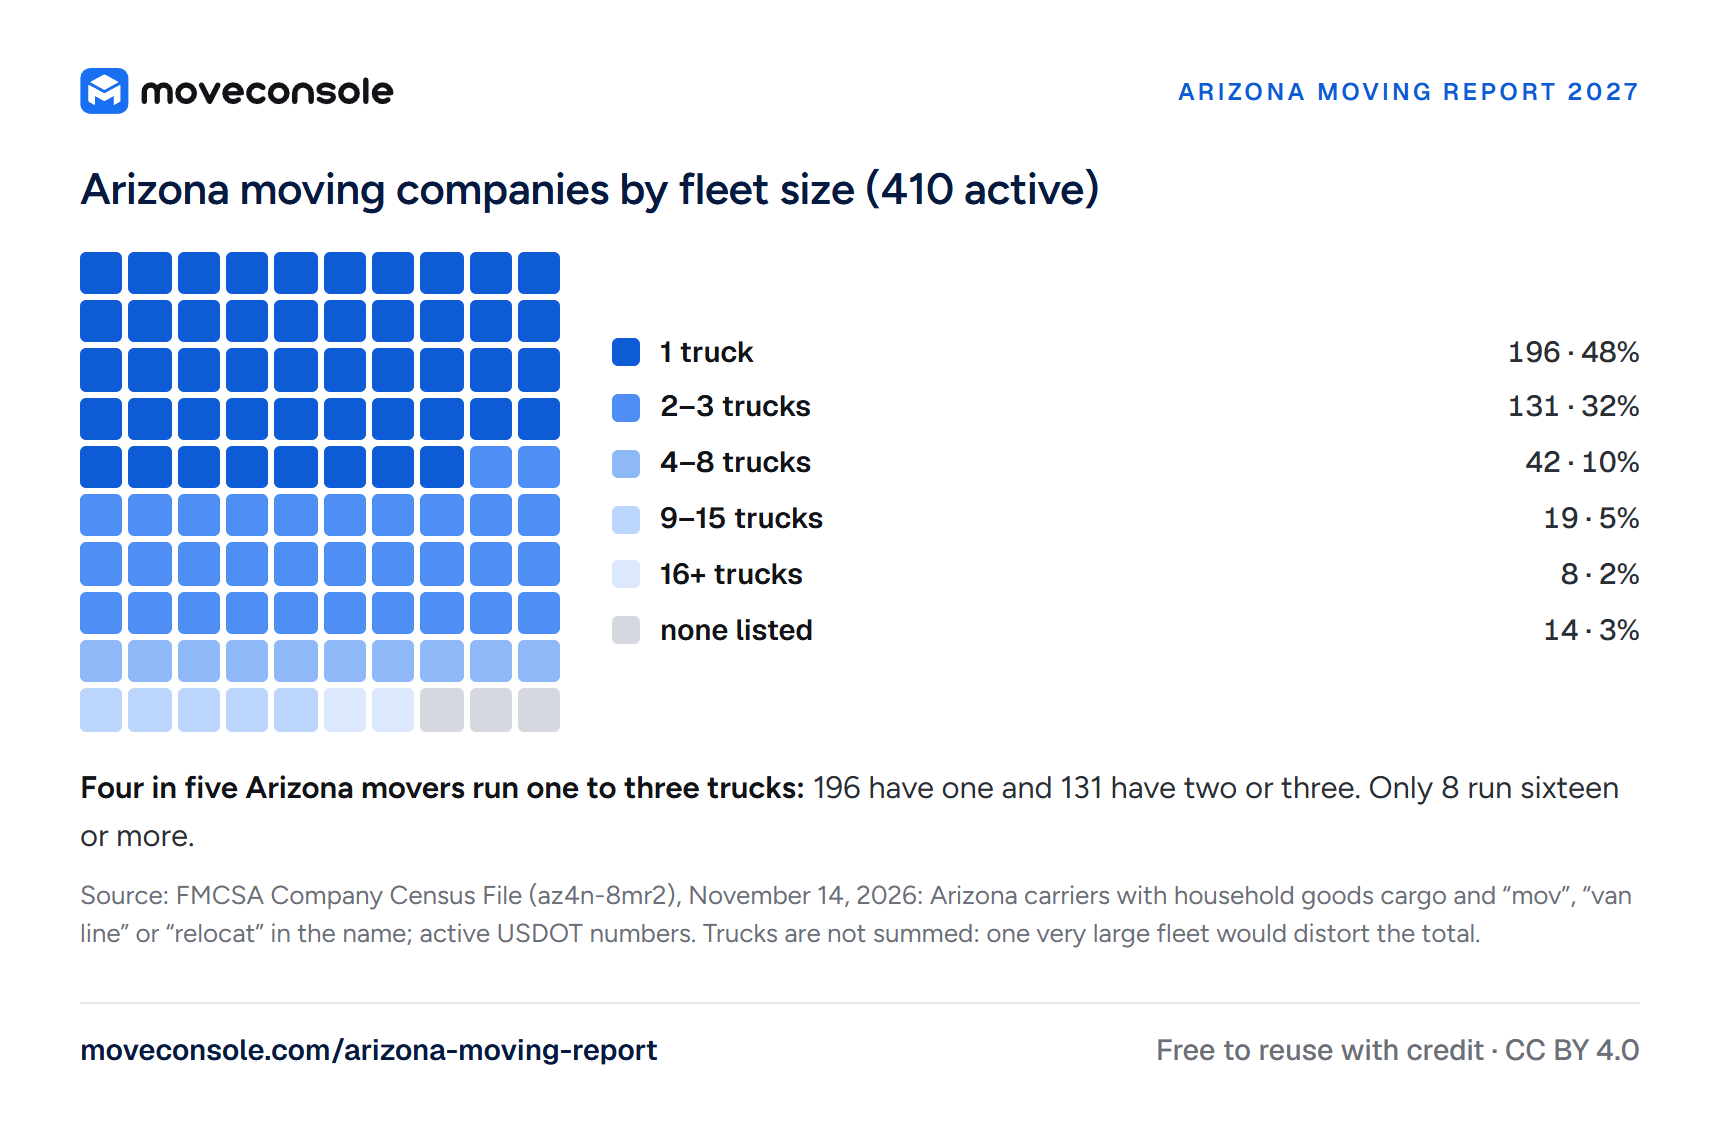
Arizona moving companies by fleet size (410 active)
- 1 truck196 · 48%
- 2–3 trucks131 · 32%
- 4–8 trucks42 · 10%
- 9–15 trucks19 · 5%
- 16+ trucks8 · 2%
- none listed14 · 3%
Show the data
| Trucks | Companies | Share |
|---|---|---|
| 1 truck | 196 | 48% |
| 2–3 trucks | 131 | 32% |
| 4–8 trucks | 42 | 10% |
| 9–15 trucks | 19 | 5% |
| 16+ trucks | 8 | 2% |
| none listed | 14 | 3% |
Arizona’s movers are small businesses. 196 run a single truck and 131 run two or three: four companies in five operate one to three trucks. 42 run four to eight, 19 run nine to fifteen, and 8 run sixteen or more; 14 list no trucks at all. We don’t add the trucks up into a statewide total, because one very large fleet would distort it.
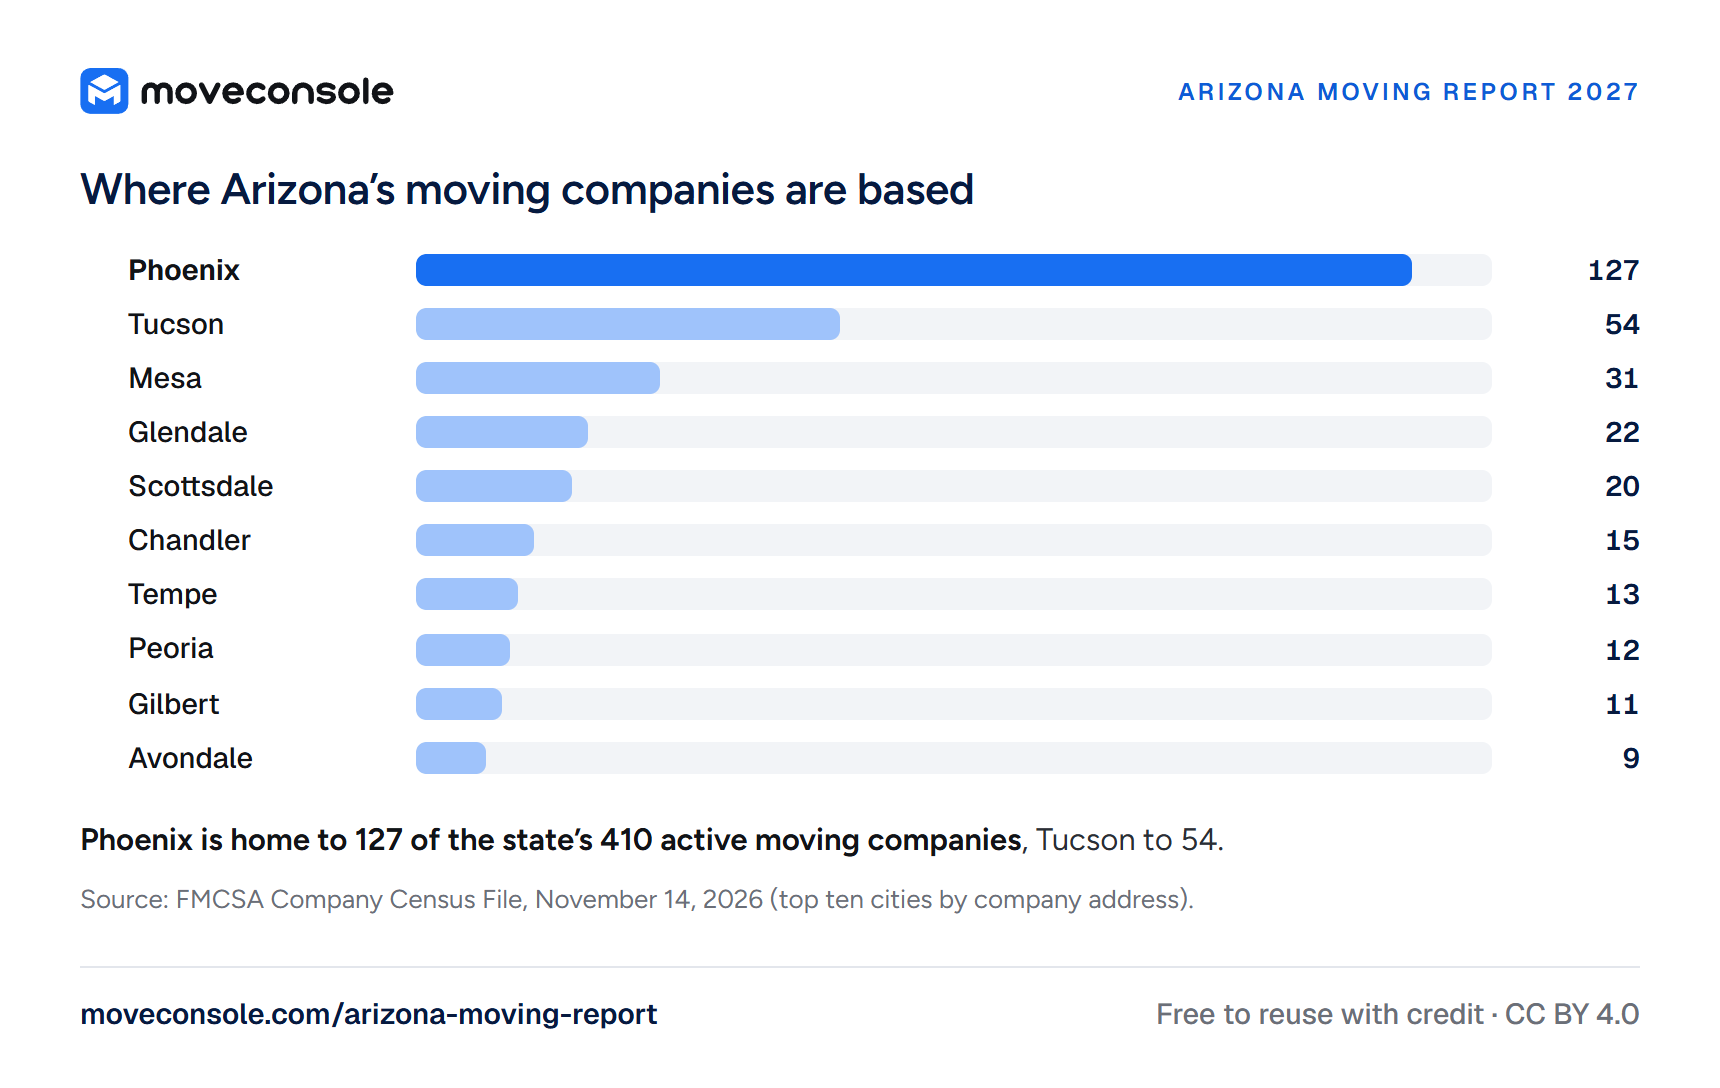
Where Arizona’s moving companies are based
Show the data
| City | Moving companies |
|---|---|
| Phoenix | 127 |
| Tucson | 54 |
| Mesa | 31 |
| Glendale | 22 |
| Scottsdale | 20 |
| Chandler | 15 |
| Tempe | 13 |
| Peoria | 12 |
| Gilbert | 11 |
| Avondale | 9 |
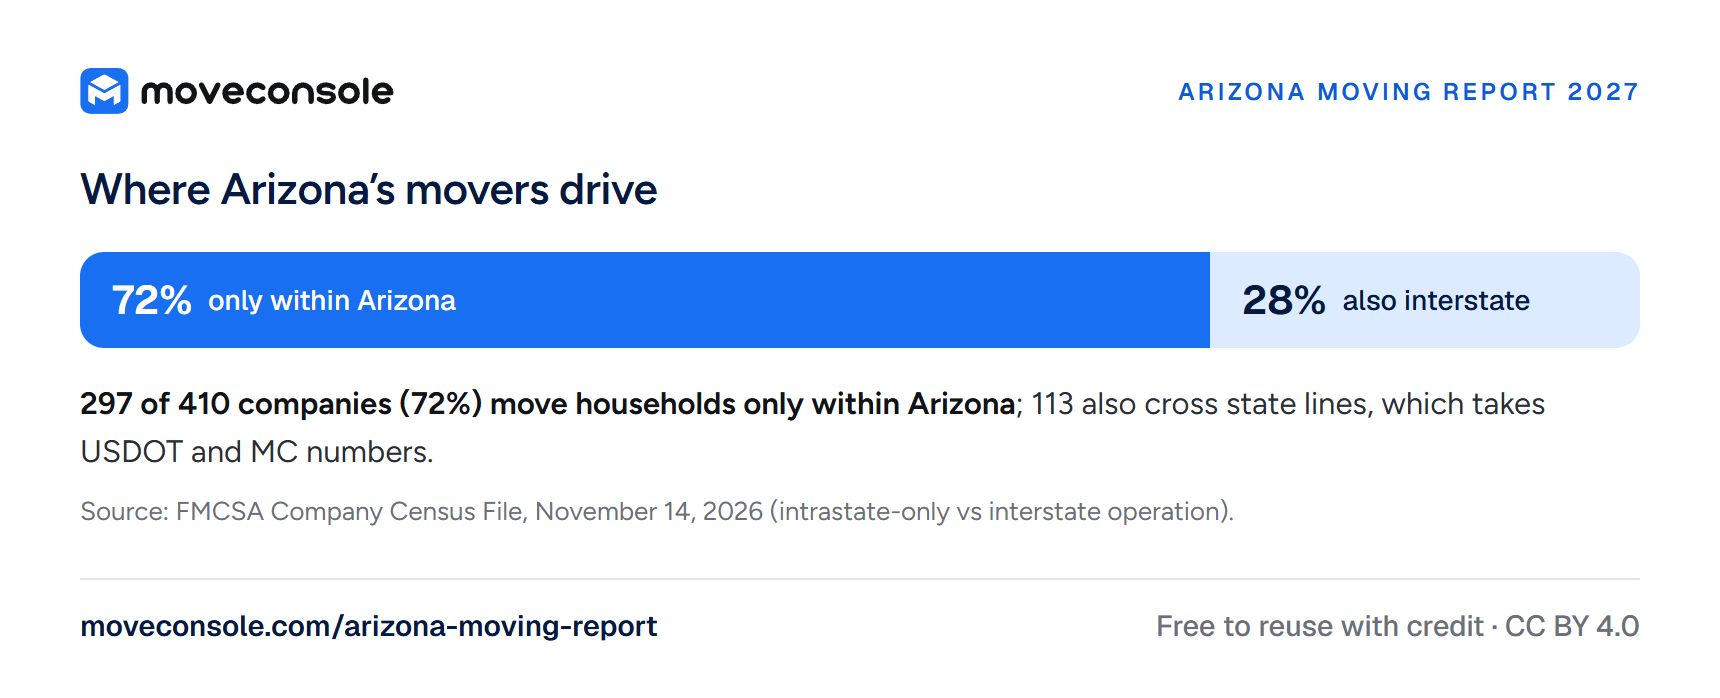
The companies cluster where the people are. Phoenix has 127 of them and Tucson 54, followed by Mesa (31), Glendale (22) and Scottsdale (20). Most work only inside the state: 297 companies, or 72%, are registered for intrastate moves only, while 113 (28%) also cross state lines.
Where Arizona’s movers drive
Show the data
| Operation | Companies | Share |
|---|---|---|
| Only within Arizona | 297 | 72% |
| Also interstate | 113 | 28% |
New movers, and how many last
The median Arizona moving company is 11.3 years old, and 29% registered in the last five years. Starting is easy; staying is harder. Of the 124 moving companies registered in 2021–2023, 60 — 48% — still hold an active USDOT number. Companies registered in 2018 have kept 19 of 25.
Moving companies registered each year, and how many are still active
- 7/15’16
- 7/9’17
- 19/25’18
- 11/15’19
- 15/25’20
- 22/41’21
- 20/46’22
- 18/37’23
- 34/38’24
- 25/29’25
- 19/19’26*
Still activeRegistered that year

Show the data
| Year registered | Registered | Still active | Share active |
|---|---|---|---|
| 2016 | 15 | 7 | 47% |
| 2017 | 9 | 7 | 78% |
| 2018 | 25 | 19 | 76% |
| 2019 | 15 | 11 | 73% |
| 2020 | 25 | 15 | 60% |
| 2021 | 41 | 22 | 54% |
| 2022 | 46 | 20 | 43% |
| 2023 | 37 | 18 | 49% |
| 2024 | 38 | 34 | 89% |
| 2025 | 29 | 25 | 86% |
| 2026 (to Nov 14) | 19 | 19 | 100% |
Jobs and pay
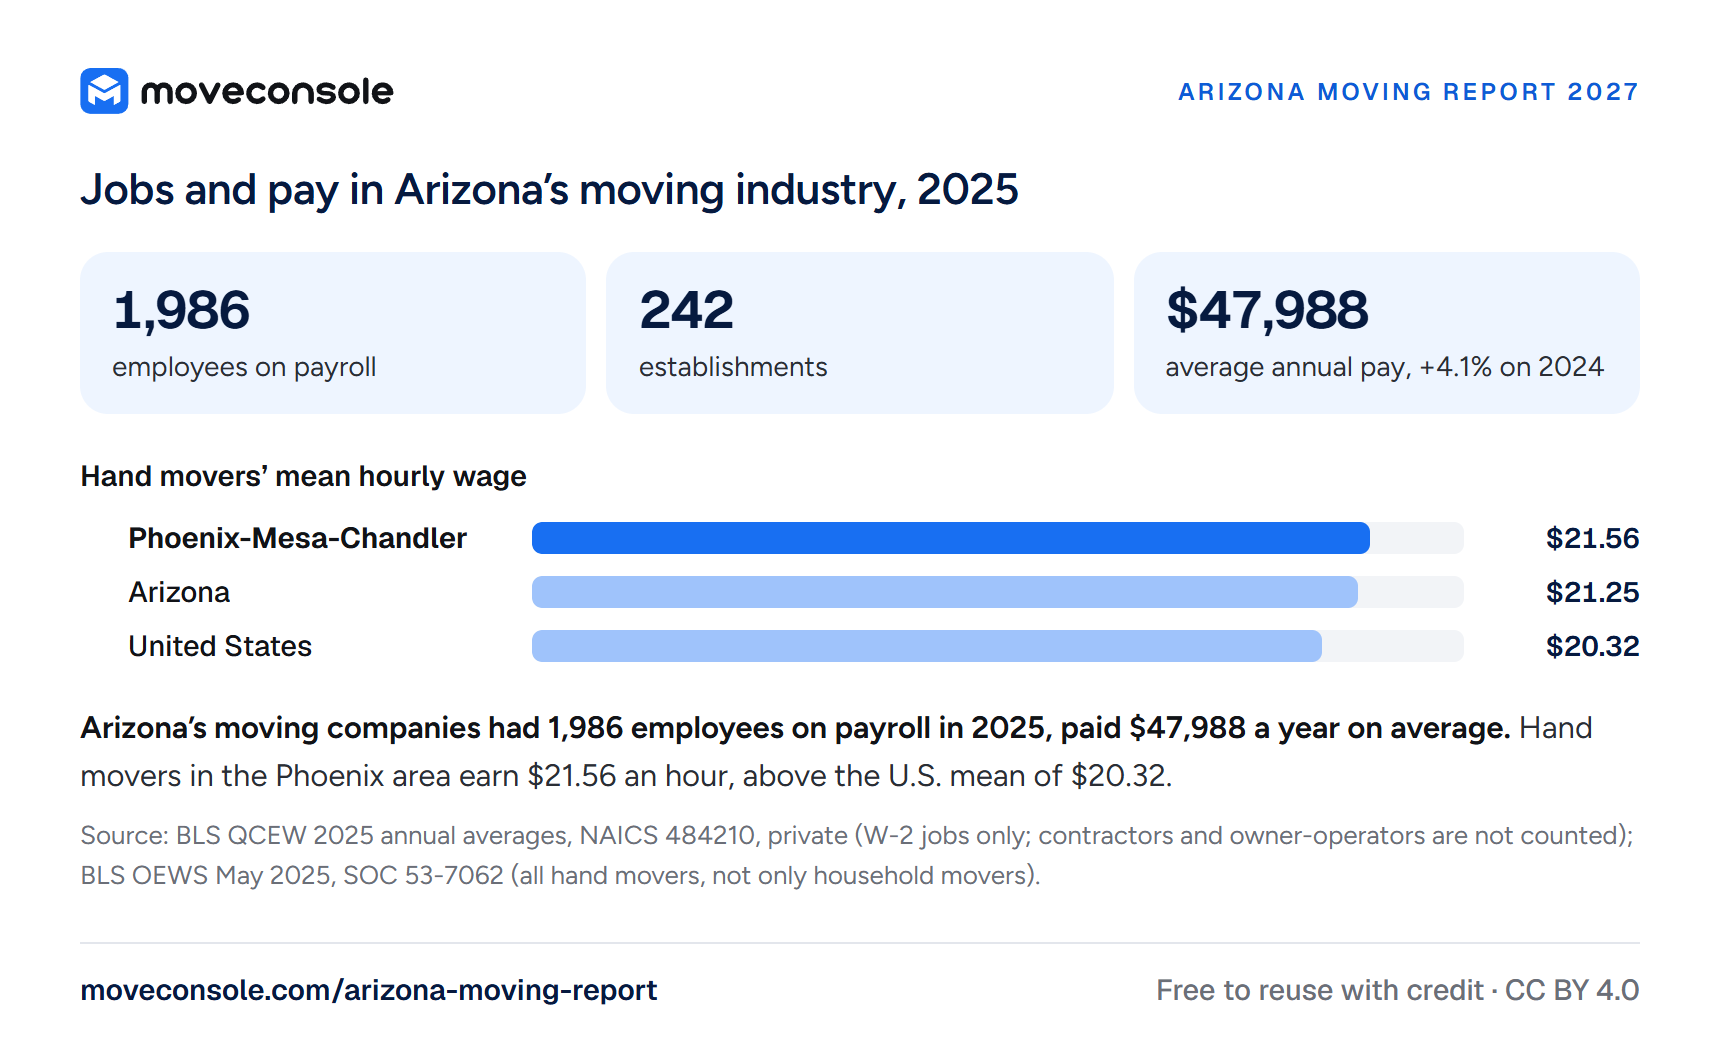
The Bureau of Labor Statistics counts payroll jobs by industry. In 2025, Arizona’s household and office goods moving industry had 242 establishments and 1,986 employees, with an average annual pay of $47,988, up 4.1% on 2024. Maricopa County accounts for 158 establishments and 1,504 employees ($49,296); Pima County for 31 establishments and 348 employees ($42,872). These are W-2 jobs only — contractors and owner-operators are not counted, so the real workforce is larger.
Jobs and pay in Arizona’s moving industry, 2025
Hand movers’ mean hourly wage
Show the data
| Establishments | Employees | Average annual pay | |
|---|---|---|---|
| Arizona | 242 | 1,986 | $47,988 |
| Maricopa County | 158 | 1,504 | $49,296 |
| Pima County | 31 | 348 | $42,872 |
For hourly work, BLS publishes wages for hand movers — the occupation that includes moving crews along with warehouse and stock movers. In the Phoenix-Mesa-Chandler area the mean is $21.56 an hour ($44,840 a year), above the Arizona mean of $21.25 and the U.S. mean of $20.32.
How Arizona movers sell online
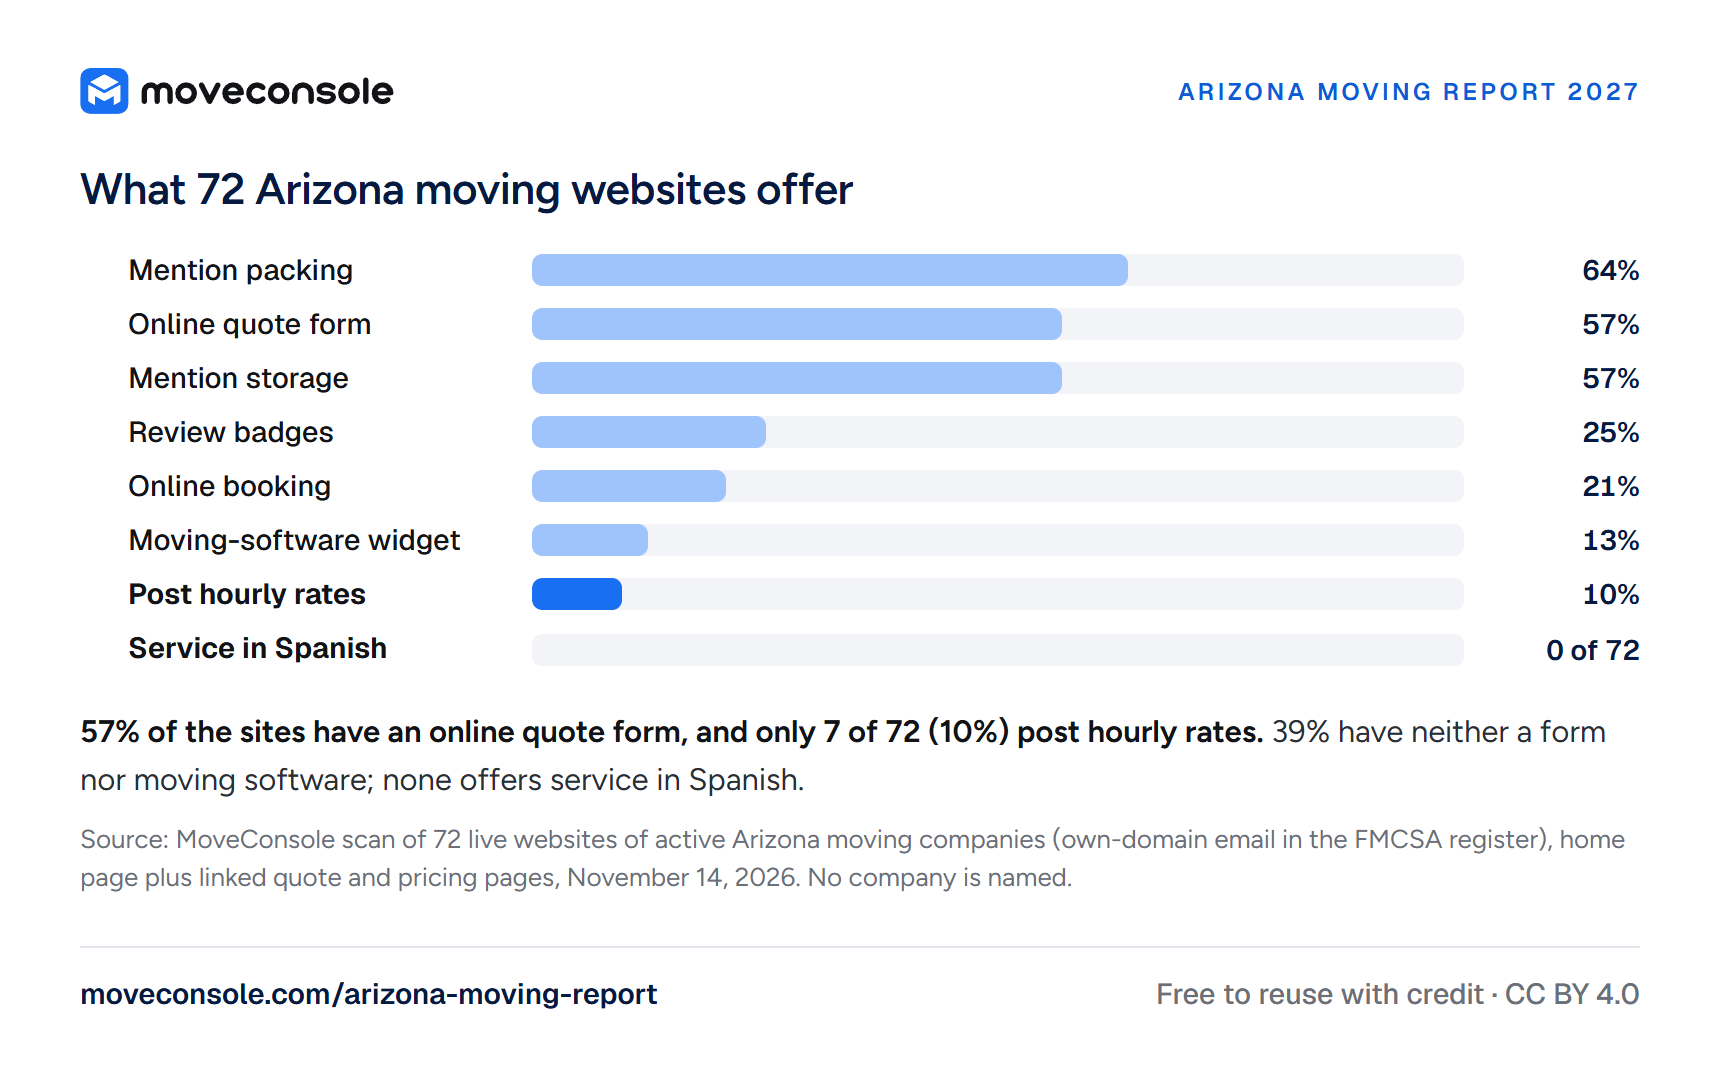
A household that has just arrived from another state usually finds a mover online. To see what it finds, we scanned 72 live websites of active Arizona moving companies — every one whose email in the federal register is on its own domain — looking at the home page and the quote and pricing pages it links to. We name no company.
What 72 Arizona moving websites offer
Show the data
| Feature | Sites | Share |
|---|---|---|
| Mention packing | 46 | 63.9% |
| Online quote form | 41 | 56.9% |
| Mention storage | 41 | 56.9% |
| Review badges | 18 | 25% |
| Online booking | 15 | 20.8% |
| Moving-software widget | 9 | 12.5% |
| Post hourly rates | 7 | 9.7% |
| Service in Spanish | 0 | 0% |
| Neither a form nor moving software | 28 | 38.9% |
| Built on WordPress | 33 | 45.8% |
| Built on Squarespace | 6 | 8.3% |
| Built on Wix | 5 | 6.9% |
| Built on GoDaddy | 5 | 6.9% |
| Built on GoHighLevel | 4 | 5.6% |
| Built on Webflow | 3 | 4.2% |
| Built on Weebly | 2 | 2.8% |
| Built on Shopify | 1 | 1.4% |
57% of the sites have an online quote form, and 9 of the 72 use a moving-software widget. 39% have neither: the visitor is asked to call or email. 21% invite customers to book online. Only 10% — 7 of 72 — publish hourly rates, even though price is the first thing most customers want to know.
Most sites list the extras: 64% mention packing and 57% storage; 25% show review badges. Every site uses HTTPS, and 88% declare a mobile layout. Nearly half (46%) run on WordPress; site builders such as Squarespace, Wix, GoDaddy, GoHighLevel and Webflow account for most of the rest.
The Spanish gap
Spanish at home vs. Spanish on moving websites
Show the data
| Value | |
|---|---|
| Arizonans who speak Spanish at home | 1,373,997 (19.1%) |
| Moving websites with service in Spanish | 0 of 72 |
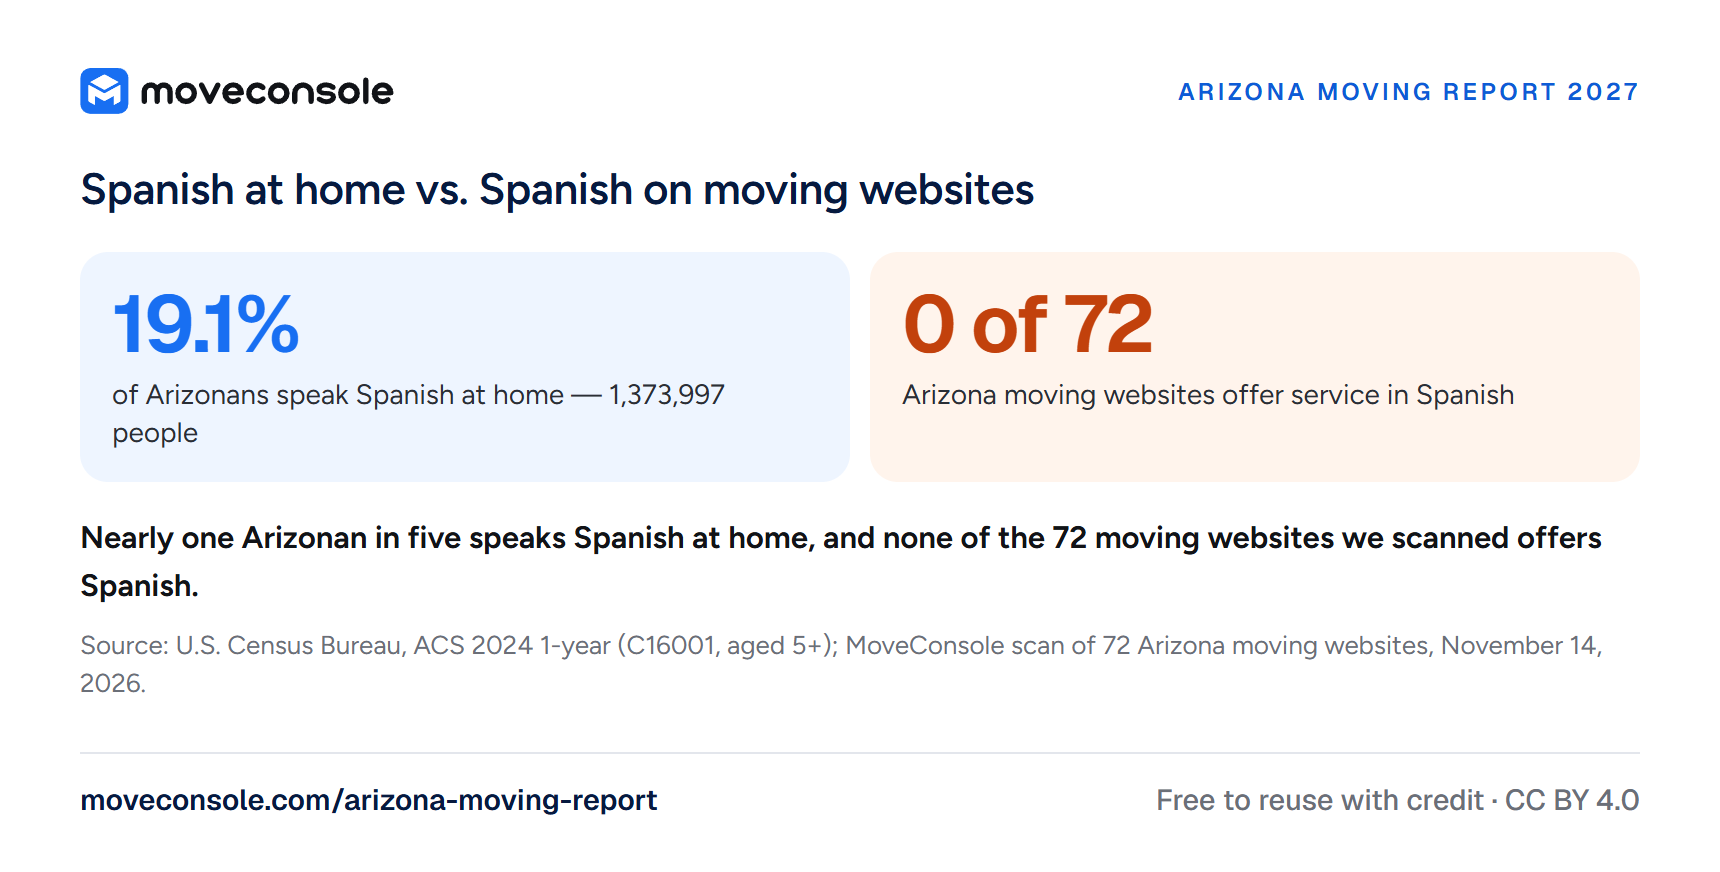
Nearly one Arizonan in five — 19.1%, or 1,373,997 people — speaks Spanish at home, against 13.9% nationally, and 468,506 of them speak English less than “very well”. None of the 72 sites offers service in Spanish or a language switch. It is the widest gap in this report between who Arizona’s customers are and how its movers talk to them.
The scan reads what a visitor sees on those pages; a feature mentioned only deeper in a site may be missed. The sample covers companies whose public email is on their own domain, which leans toward companies that have a real website.
The rules
- No state license. Arizona does not license or register household movers, according to the Arizona Attorney General’s guide for in-state moves. Checking a mover’s record is up to the customer.
- No holding goods hostage. Since 2017 (A.R.S. §§ 44-1611 to 44-1616, enacted by HB 2145), a mover may not hold an in-state customer’s belongings hostage. The Arizona Department of Public Safety handles enforcement for household goods moves.
- Federal numbers across state lines. A company that moves households between states must have a USDOT number and an MC number from FMCSA, and follows the federal rules for interstate moves.
How to choose a mover in Arizona
- Look up the mover’s USDOT number on FMCSA’s website. For a move to or from another state, the company also needs an MC number.
- Check the Arizona Moving Association. Arizona doesn’t license movers, but the Attorney General’s guide for in-state moves names the Arizona Moving Association (AZMA), along with FMCSA, as a place to go for help and guidance during a move. The AZMA member directory lists the companies that belong.
- Get written estimates — the Attorney General suggests at least three — based on a walkthrough, a video call or an itemized inventory, and ask what they include: travel time, stairs, packing, materials.
- Plan around the heat. From June to August, book the earliest start you can: in July, Phoenix averages 88°F at 6 a.m. and passes 100°F by noon.
- Know your rights. On a move within Arizona, a mover may not hold your belongings hostage. Complaints about household goods moves go to the Arizona Department of Public Safety.
- Read reviews for how problems were handled, not only for the star rating.
What it means for moving companies
The customer is often new to Arizona. Many arrive from Southern California, Seattle and Chicago, and they find a mover on the web, often from a phone. Nearly two in five Arizona moving sites (39%) still give them no way to ask for a quote except a call or an email.
Prices are a gap you can fill. Only 7 of 72 sites publish an hourly rate. A visible rate, or an estimate the customer can get online, answers the first question before a competitor does.
Spanish is the widest gap. Nearly one Arizonan in five speaks Spanish at home, and none of the sites we scanned offers service in it. A Spanish page and a crew lead who can take the call go a long way.
Plan the summer by the clock. Demand peaks in June, and July holds about ten hours a day at 100°F or more in Phoenix. Dawn starts, water on the truck and jobs that finish by early afternoon keep crews safe and moves on schedule.
Be where careful customers look. The same Attorney General’s guide points Arizonans to FMCSA and to AZMA for help with a move. Keep your USDOT record current, and if you belong to the association, say so on your website.
We make MoveConsole, software for moving companies: an online quote form that prices a move from the customer’s inventory, scheduling by truck and crew, and a customer portal for estimates, contracts and payments. We built this report from public data so that any Arizona mover — and any Arizonan planning a move — can use it.
Sources and methodology
- Who moved, and Spanish at home: U.S. Census Bureau, American Community Survey 2024 1-year estimates, tables B07003 (residence one year ago, all residents aged 1+) and C16001 (language spoken at home, aged 5+). Estimates carry margins of error.
- Migration and income: IRS Statistics of Income, U.S. Population Migration Data, 2022–2023, county inflow and outflow files. Households are tax returns; income is average adjusted gross income per return.
- Arrivals from other states, rankings: USAFacts (ACS 2024); University of Arizona Eller College (net domestic migration, 2024); U-Haul Growth Index 2025.
- Heat: NOAA National Centers for Environmental Information, GHCN-Daily station records for Phoenix Sky Harbor (USW00023183), Tucson (USW00023160) and Flagstaff (USW00003103), and hourly Integrated Surface Data for Phoenix Sky Harbor (72278023183), 2016–2025, local time. Our count of 70 days at 110°F in 2024 matches the National Weather Service record. The normal of 21 days is the NWS 1991–2020 normal.
- Search demand: Google Trends, the term “movers”, January 2021 to December 2025; the monthly average of the weekly index, each region scaled to its own peak.
- Moving companies: FMCSA Company Census File (az4n-8mr2), pulled November 14, 2026: carriers based in Arizona with household goods cargo and “mov”, “van line” or “relocat” in the name. The filter misses some movers. Active means an active USDOT number.
- Jobs and pay: BLS Quarterly Census of Employment and Wages, 2025 annual averages, NAICS 484210, private sector (W-2 jobs only); BLS Occupational Employment and Wage Statistics, May 2025, SOC 53-7062 (all hand movers, not only household movers).
- Moving websites: MoveConsole’s scan of 72 live websites of active Arizona moving companies whose FMCSA email is on their own domain, November 14, 2026: the home page and the linked quote and pricing pages. No company is named.
- Rules: Arizona Attorney General, Rogue Mover/Hostage Load Reference Guide (2025); HB 2145 (2017), A.R.S. §§ 44-1611 to 44-1616; Arizona Department of Public Safety.
Reuse. The charts and data in this report are free to use under CC BY 4.0: credit MoveConsole and link to this page. Each chart has a “Download image” link: a PNG with the credit already on it. You can also download all 15 charts at once (ZIP, 1.9 MB) or the data behind them (JSON).
Updates. We refresh the report every January with the newest releases of these sources.
More guides for movers
How to calculate cubic feet for a move
The formula, cubic feet by room and by item, box sizes and how much fits in a truck.
9 min readHow to start a moving company
Licenses, insurance, trucks, crew, prices and systems — in the order you’ll need them.
10 min readWhat is a moving CRM?
The features that win jobs, a sample sales pipeline and the numbers worth watching.
9 min read